What is a Unimodal Distribution?
A unimodal distribution in statistics refers to a frequency distribution that has only one peak. Unimodality means that a single value in the distribution occurs more frequently than any other value. The peak represents the most common value, also known as the mode.

In a symmetric unimodal distribution, the mean, median, and mode all occur at the peak. For asymmetric distributions, only the mode falls at the peak.
Learn about Frequency Distributions , Mean, Median, and Mode, and How to Find the Mode.
Unimodal vs Bimodal Distributions
In contrast, a bimodal distribution has two peaks or modes, indicating two distinct groups within the data. You frequently observe this type of distribution when two different processes or populations contribute to the data.
For example, a bimodal distribution could be seen in the height distribution of a group of people if there were two distinct groups, such as children and adults. The data would have two peaks, one for the children’s heights and one for the adults’ heights.

Learn more about Bimodal Distributions: Definition, Examples & Analysis.
Unimodal Distribution Examples
Unimodal distributions describe a wide variety of phenomena, from the heights of people to the time between earthquakes. Correspondingly, they come in a diverse array of shapes. For example, they can be symmetrical, right-skewed, or left-skewed and still have only one peak. Here are common examples you might encounter in your studies.
Learn more about Skewed Distributions.
Normal Distribution
The most well-known example of a unimodal distribution is the normal distribution, also known as the Gaussian distribution. It is a bell-shaped distribution that occurs naturally in many real-world situations, such as heights and IQ scores.

This distribution of heights for 14 year old girls has a single peak of 1.512 meters.
Learn more about the Normal Distribution.
Poisson Distribution
The Poisson distribution is another example of a unimodal distribution. Analysts use it to describe a count of events that occur within a fixed time interval or in a specific region of space. It is commonly used in biology, economics, and physics.

This distribution of the number of complaints per day at a store has a single peak at three complaints per day.
Learn more about the Poisson Distribution: Definition & Uses.
Exponential Distribution
The exponential distribution is a unimodal distribution that statisticians frequently use to model the time between independent events. For instance, reliability engineers use it to model the time until the failure of a component or system.
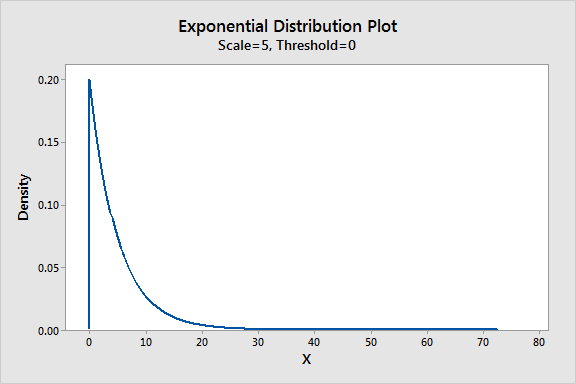
The graph displays a single peak at zero and then declines as values increase. This distribution might represent a process that has the highest probability of failure immediately and the likelihood declines sharply as time passes.
Learn more about Independent Events and the Exponential Distribution.
Lognormal Distribution
The lognormal distribution is a unimodal distribution that describes various right-skewed phenomenon, such as the distribution of incomes and body fat percentages, among other things.

This distribution of body fat percentages for 14 year old girls has a single peak at 24%. For more examples of this distribution, read my post A Statistical Thanksgiving, where I show how it models incomes around the world.
Learn more about the Lognormal Distribution.
Test Statistics
Hypothesis tests produce test statistics that follow a unimodal sampling distribution. For example, t-tests use the t-distribution, ANOVA uses the F-distribution, and chi-square tests use the chi-square distribution. The following graphs show that all these sampling distributions have only one peak.


In conclusion, a unimodal distribution is a frequency distribution with only one peak, while a bimodal distribution has two peaks. Examples of unimodal distributions include the normal, Poisson, exponential, lognormal, and sampling distributions for test statistics.

Comments and Questions