What is the Root Mean Square Error?
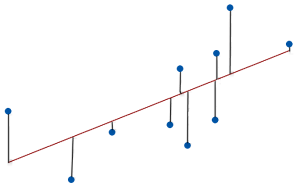
The root mean square error (RMSE) measures the average difference between a statistical model’s predicted values and the actual values. Mathematically, it is the standard deviation of the residuals. Residuals represent the distance between the regression line and the data points.
RMSE quantifies how dispersed these residuals are, revealing how tightly the observed data clusters around the predicted values.
As the data points move closer to the regression line, the model has less error, lowering the RMSE. A model with less error produces more precise predictions.
RMSE values can range from zero to positive infinity and use the same units as the dependent (outcome) variable.
Use the root mean square error to assess the amount of error in a regression or other statistical model. A value of 0 means that the predicted values perfectly match the actual values, but you’ll never see that in practice. Low RMSE values indicate that the model fits the data well and has more precise predictions. Conversely, higher values suggest more error and less precise predictions.
The root mean square error is a non-standardized goodness-of-fit assessment corresponding to its standardized counterpart—R-squared.
Analysts frequently assess this statistic in various fields, including climatology, forecasting, economics, and finance. RMSE is a crucial metric in predictive modeling, where its value indicates how well a model performs.
Interpret RMSE Example
Suppose we fit a regression model that predicts a student’s final exam score. In this case, the dependent variable is the final exam score. We include hours of studying and mid-term scores as independent variables. Learn more about Independent and Dependent Variables.
Let’s say we evaluate our model and obtain an RMSE of 4. Interpreting this RMSE tells us that the typical difference between our model’s predictions and the actual final exam scores is 4 points. By considering the scale of the dependent variable and the magnitude of the RMSE value, we can interpret the effectiveness of our regression model.
For example, if the final exam score ranges from 0 to 100, an RMSE of 4 indicates our model’s predictions are pretty accurate, with an average error rate of only 4%. We can use this information to determine whether our model’s prediction precision meets our requirements.
You can also use the root mean square error to find a rough estimate of the 95% prediction interval. Assuming your residuals approximately follow a normal distribution, about 95% of the observed values fall within a range that extends +/- 2 X RMSE from the predicted values. For our final exam example with its RMSE = 4, we can estimate that 95% of the observed values will fall within +/- 2 X 4 = 8 points of the predicted values. You can thank the Empirical Rule for this interpretation!
Note that a low root mean square error doesn’t exclude the possibility that a model is biased. You’ll need to assess the residual plots to make that determination.
RSME Formula
The RSME formula should look familiar because it is essentially the standard deviation formula. That makes sense because the root mean square error is the standard deviation of the residuals. It measures the scatter of the observed values around the predicted values.
The RSME formula for a sample is the following:

Where:
- yi is the actual value for the ith observation.
- ŷi is the predicted value for the ith observation.
- N is the number of observations.
- P is the number of parameter estimates, including the constant.
Finding the root mean square error involves calculating the residual for each observation (y – ŷ) and squaring it. Then sum all the squared residuals. Divide that sum by the error degrees of freedom in your model (N – P) to find the average squared residual, more technically known as the mean squared error (MSE). Finally, take the square root to find the RSME.
Statisticians refer to the numerator portion of the RSME formula as the sum of squares.
Note that this formula is for samples. Use N in the denominator when working with the entire population.
Root Mean Square Error Strengths and Weaknesses
Like any statistical measure, the root mean square error has its strengths and weaknesses. In this section, I cover some of RMSE’s pros and cons.
In doing so, I’ll frequently compare it to R-squared because they both evaluate a model’s goodness-of-fit, but they use different scales. The root means square error uses a non-standardized scale (0 – +∞), while R-squared uses a standardized scale (0 – 100%).
Learn How to Interpret R-Squared.
Root Mean Square Error Strengths
Intuitive Interpretation
The root mean square error is a simple metric that provides a straightforward interpretation of the model’s overall error, making it accessible to people without a solid statistical background. It is an absolute measure of the average distance that the data points fall from the predicted values using the units of the dependent variable. It can assess prediction precision directly.
Conversely, R-squared is a relative measure (percentage) for goodness-of-fit that is unitless and can’t assess precision.
Standard Metric
The root mean square error is a standard metric in many fields. Analysts frequently use it to evaluate model performance.
RMSE Weaknesses
Sensitive to Outliers
The squaring process in the root mean square error causes it to give a disproportionately higher weight to larger errors, making it more sensitive to outliers than other measures like MAPE and MSD.
Learn Five Ways to Find Outliers.
Sensitive to Overfitting
The root mean square error decreases every time you add an independent variable to the model, even when it’s just a chance correlation between variables. It never increases when adding a variable to the model. Because you want a small RMSE, you can create the appearance of a better model simply by adding more variables, even when they don’t make sense.
Note: The root mean square error shares both the outlier and overfitting problems with R-squared. Learn how the adjusted R-squared helps prevent analysts from adding too many variables.
Related Post: Overfitting a Model
Sensitive to Scale
RMSE is sensitive to the scale of the dependent variable. Consequently, interpreting it requires additional knowledge about the DV and its scale. In some cases, the root mean square error might not be comparable across different datasets or units of measurement.
Conversely, it’s easier to compare R-squared between different studies and even entirely different outcome variables because it is a standardized value and, hence, not sensitive to the scale.
In summary, the root mean square error is a widely used metric in many fields with an intuitive interpretation and it directly assesses predictive precision. However, it is sensitive to outliers, overfitting, and scale.
RSME is similar to the standard error of the regression (S), but S has a vital difference.

Thanks! I got the idea!
About RSMS I think is a typo in your blog text (please see in last lines).
Cheers!
Thanks for catching that typo!! I fixed it!
Hello Jim..
Fantastic as usual!
I have a question..
RSMS (RMSE??) is similar to the standard error of the regression (S), but S has a vital difference…. and… what is this vital difference? Why Minitab uses S and other softwares RMSE?
Thank you!
Hi Victor,
Yes, it’s the RSME, also known as RSMD (for deviation). I’ve never heard of statisticians referring to it as RSMS, but perhaps that a different language?
I talk about the difference in the other post that I link to about the standard error of the regression (S). In a nutshell, S adjusts for the number of predictors like adjusted R-squared and RSME does not. So, RMSE corresponds to the regular R-squared, while S corresponds to the adjusted R-squared. That’s important for comparing models with differing numbers of predictors.
As to why Minitab uses S and others use RSME, I’m not sure. When I worked at Minitab, it just seemed to be the better statistic, but it’s not used as much elsewhere.