Mean squared error (MSE) measures the amount of error in statistical models. It assesses the average squared difference between the observed and predicted values. When a model has no error, the MSE equals zero. As model error increases, its value increases. The mean squared error is also known as the mean squared deviation (MSD).
For example, in regression, the mean squared error represents the average squared residual.
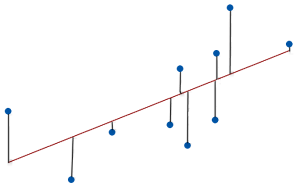
As the data points fall closer to the regression line, the model has less error, decreasing the MSE. A model with less error produces more precise predictions.
MSE Formula
The formula for MSE is the following.

Where:
- yi is the ith observed value.
- ŷi is the corresponding predicted value.
- n = the number of observations.
The calculations for the mean squared error are similar to the variance. To find the MSE, take the observed value, subtract the predicted value, and square that difference. Repeat that for all observations. Then, sum all of those squared values and divide by the number of observations.
Notice that the numerator is the sum of the squared errors (SSE), which linear regression minimizes. MSE simply divides the SSE by the sample size. Learn more about Sum of Squares: Definition, Formula & Types.
Interpreting the Mean Squared Error
The MSE is the average squared distance between the observed and predicted values. Because it uses squared units rather than the natural data units, the interpretation is less intuitive.
Squaring the differences serves several purposes.
Squaring the differences eliminates negative values for the differences and ensures that the mean squared error is always greater than or equal to zero. It is almost always a positive value. Only a perfect model with no error produces an MSE of zero. And that doesn’t occur in practice.
Additionally, squaring increases the impact of larger errors. These calculations disproportionately penalize larger errors more than smaller errors. This property is essential when you want your model to have smaller errors.
If you take the square root of the MSE, you obtain the root mean square error (RMSE), which does use the natural data units. In other words, MSE is analogous to the variance, whereas RMSE is akin to the standard deviation.

Hi Jim, If you have a categorical factor in a model where that factor has an effect on the response variable, does the MSE tends to grow smaller as the number of datapoints per level increases?