What is One Way ANOVA?
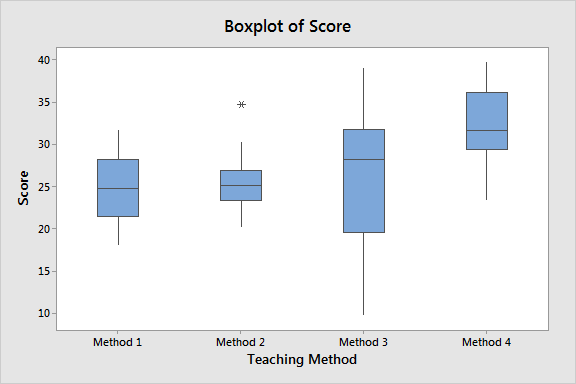
Use one way ANOVA to compare the means of three or more groups. This analysis is an inferential hypothesis test that uses samples to draw conclusions about populations. Specifically, it tells you whether your sample provides sufficient evidence to conclude that the groups’ population means are different. ANOVA stands for analysis of variance. [Read more…] about One Way ANOVA Overview & Example