The Chi-square test of independence determines whether there is a statistically significant relationship between categorical variables. It is a hypothesis test that answers the question—do the values of one categorical variable depend on the value of other categorical variables? This test is also known as the chi-square test of association.
 As you no doubt guessed, I’m a huge fan of statistics. I’m also a big Star Trek fan. Consequently, it’s not surprising that I’m writing a blog post about both! In the Star Trek TV series, Captain Kirk and the crew wear different colored uniforms to identify the crewmember’s work area. Those who wear red shirts have the unfortunate reputation of dying more often than those who wear gold or blue shirts.
In this post, I’ll show you how the Chi-square test of independence works. Then, I’ll show you how to perform the analysis and interpret the results by working through the example. I’ll use this test to determine whether wearing the dreaded red shirt in Star Trek is the kiss of death!
If you need a primer on the basics, read my hypothesis testing overview.
Overview of the Chi-Square Test of Independence
The Chi-square test of association evaluates relationships between categorical variables. Like any statistical hypothesis test, the Chi-square test has both a null hypothesis and an alternative hypothesis.
- Null hypothesis: There are no relationships between the categorical variables. If you know the value of one variable, it does not help you predict the value of another variable.
- Alternative hypothesis: There are relationships between the categorical variables. Knowing the value of one variable does help you predict the value of another variable.
The Chi-square test of association works by comparing the distribution that you observe to the distribution that you expect if there is no relationship between the categorical variables. In the Chi-square context, the word “expected” is equivalent to what you’d expect if the null hypothesis is true. If your observed distribution is sufficiently different than the expected distribution (no relationship), you can reject the null hypothesis and infer that the variables are related.
For a Chi-square test, a p-value that is less than or equal to your significance level indicates there is sufficient evidence to conclude that the observed distribution is not the same as the expected distribution. You can conclude that a relationship exists between the categorical variables.
When you have smaller sample sizes, you might need to use Fisher’s exact test instead of the chi-square version. To learn more, read my post, Fisher’s Exact Test: Using and Interpreting.
Star Trek Fatalities by Uniform Colors
We’ll perform a Chi-square test of independence to determine whether there is a statistically significant association between shirt color and deaths. We need to use this test because these variables are both categorical variables. Shirt color can be only blue, gold, or red. Fatalities can be only dead or alive.
The color of the uniform represents each crewmember’s work area. We will statistically assess whether there is a connection between uniform color and the fatality rate. Believe it or not, there are “real” data about the crew from authoritative sources and the show portrayed the deaths onscreen. The table below shows how many crewmembers are in each area and how many have died.
| Color | Areas | Crew | Fatalities |
| Blue | Science and Medical | 136 | 7 |
| Gold | Command and Helm | 55 | 9 |
| Red | Operations, Engineering, and Security | 239 | 24 |
| Ship’s total | All | 430 | 40 |
Tip: Because the chi-square test of association assesses the relationship between categorical variables, bar charts are a great way to graph the data. Use clustering or stacking to compare subgroups within the categories.

Related post: Bar Charts: Using, Examples, and Interpreting
Performing the Chi-Square Test of Independence for Uniform Color and Fatalities
For our example, we will determine whether the observed counts of deaths by uniform color are different from the distribution that we’d expect if there is no association between the two variables.
The table below shows how I’ve entered the data into the worksheet. You can also download the CSV dataset for StarTrekFatalities.
| Color | Status | Frequency |
| Blue | Dead | 7 |
| Blue | Alive | 129 |
| Gold | Dead | 9 |
| Gold | Alive | 46 |
| Red | Dead | 24 |
| Red | Alive | 215 |
You can use the dataset to perform the analysis in your preferred statistical software. The Chi-squared test of independence results are below. As an aside, I use this example in my post about degrees of freedom in statistics. Learn why there are two degrees of freedom for the table below.
To perform this analysis yourself, enter the observed values in each cell into a 2 X 3 table in my Chi-Square Calculator.

In our statistical results, both p-values are less than 0.05. We can reject the null hypothesis and conclude there is a relationship between shirt color and deaths. The next step is to define that relationship.
Describing the relationship between categorical variables involves comparing the observed count to the expected count in each cell of the Dead column. I’ve annotated this comparison in the statistical output above.
Statisticians refer to this type of table as a contingency table. To learn more about them and how to use them to calculate probabilities, read my post Using Contingency Tables to Calculate Probabilities.
Related post: Chi-Square Table
Use my Chi-Square Calculator to perform this test yourself!
Graphical Results for the Chi-Square Test of Association
Additionally, you can use bar charts to graph each cell’s contribution to the Chi-square statistic, which is below.

Surprise! It’s the blue and gold uniforms that contribute the most to the Chi-square statistic and produce the statistical significance! Red shirts add almost nothing. In the statistical output, the comparison of observed counts to expected counts shows that blue shirts die less frequently than expected, gold shirts die more often than expected, and red shirts die at the expected rate.
The graph below reiterates these conclusions by displaying fatality percentages by uniform color along with the overall death rate.

The Chi-square test indicates that red shirts don’t die more frequently than expected. Hold on. There’s more to this story!
Time for a bonus lesson and a bonus analysis in this blog post!
2 Proportions test to compare Security Red-Shirts to Non-Security Red-Shirts
The bonus lesson is that it is vital to include the genuinely pertinent variables in the analysis. Perhaps the color of the shirt is not the critical variable but rather the crewmember’s work area. Crewmembers in Security, Engineering, and Operations all wear red shirts. Maybe only security guards have a higher death rate?
We can test this theory using the 2 Proportions test. We’ll compare the fatality rates of red-shirts in security to red-shirts who are not in security.
The summary data are below. In the table, the events represent the counts of deaths, while the trials are the number of personnel.
| Events | Trials | |
| Security | 18 | 90 |
| Not security | 6 | 149 |

The p-value of 0.000 signifies that the difference between the two proportions is statistically significant. Security has a mortality rate of 20% while the other red-shirts are only at 4%.
Security officers have the highest mortality rate on the ship, closely followed by the gold-shirts. Red-shirts that are not in security have a fatality rate similar to the blue-shirts.
As it turns out, it’s not the color of the shirt that affects fatality rates; it’s the duty area. That makes more sense.
Risk by Work Area Summary
The Chi-square test of independence and the 2 Proportions test both indicate that the death rate varies by work area on the U.S.S. Enterprise. Doctors, scientists, engineers, and those in ship operations are the safest with about a 5% fatality rate. Crewmembers that are in command or security have death rates that exceed 15%!
Share this:

Reader Interactions
Comments
Comments and Questions

Hi Jim
I read this chi-squared example your excellent book on hypothesis testing but there a couple of things that I can’t quite reconcile:
You decribed the proportion of observed Red shirts fatalities as being the same as the expected. Relative to the Blue and Gold comparison the Red Shirt fatality rate (24) is much closer to the expected rate (22.23) but it isn’t exactely the same.
How different would it need to be to conclude that it is different as opposed to just being the least important in a context where we have concluded that there is an association between shirt colour and fatality rates? Would this need to be answered by a series of chi squared tests (or 2 proportion test) that considered the combination of one shirt colour compared with the sum of other shirt colours. I have tried this with the following p values resultinh from the chi-squared test in excel.
Red shirt v non-red shirt pvalue = 0.554809933
Blue shirt v non-blue shirt pvalue = 0.04363293
Gold shirt v non-gold shirt = 0.053533022
This would suggest that if the question was “do gold shirts die more frequently than other colours” the answer would be that the data does not rule out the null hypothesis. For blue shirts this test would suggest that the data can rule out the null hypothesis yet in the full three colour test Gold contributed the most to the chi-squared statistic.
I have a similar example from my work which looks at the proportions of customers using two different websites and considers the proportions which are new customers, existing customers and customers returned after a long gap (reactivated).
For that test the chi-squared test p value was sufficient to rule out the null hypothesis with reactivated customers contributing the most to the chi-squared statistic. But no individual test which set each customer group against the sum of the others would be considered significant.
Is this comparison gold shirt versus non-shirt or reactivated customers v other customers not a valid use of this test?
Rob
Hi Jim. I am using R to calclate a chi sqaure of independence. I have an value of 1.486444 with a P value greater than 0.05. My question is how do I interpet the value of 1.48644? Is this a strong association between two variables or a weak association?
Hi Glenn,
You really just look at the p-value. If you assess the chi-square value, you need as the chi-square value in conjunction with a chi-square distribution with the correct degrees of freedom and use that to calculate the probability. But the p-value does that for you!
In your case, the p-value is greater than your significance level. So, you fail to reject the null hypothesis. You have insufficient evidence to conclude that an association exists between your variables.
Also, it’s important to note that this test doesn’t indicate the strength of association. It only tells you whether your sample data provide sufficient evidence to conclude that an association exists in the population. Unfortunately, you can’t conclude that an association exists.
Hi Jim,
Thank you this was such a helpful article.
I’m not sure if you check these comments anymore, yet if you do I did have a quick question for you. I was trying to follow along in SPSS to reproduce your example and I managed to do most of it. I put your data in, used Weight Cases by Frequency of Deaths, and then was able to do the Chi Square analysis that achieved the exact same results as yours.
Unfortunately, I am totally stuck on the next part where you do the 2 graphs, especially the Percentage of Fatalities by Shirt Color. The math makes sense – it’s just e.g., Gold deaths / (Gold deaths + Gold Alive). However, I cannot seem to figure out how to create a bar chart like that in SPSS!? I’ve tried every combination of variables and settings I can think of in the Chart Builder and no luck. I’ve also tried the Compute Variable option with various formulas to create a new column with the death percentages by shirt color but can’t find a way to sum the frequencies.. The best I can get is using an IF statement so it only calculates on the rows with a Death statistic and then I can get the first part: Frequency / ???, but can’t sum the 2 frequencies of Deaths & Alive per shirt colour to calculate the figure properly. And I’m not sure what other things I can try.
So basically I’m totally stuck at the moment. If by some chance you see this, is there any chance you might please be able to help me figure out how to do that Percentage of Fatalities by Shirt Color bar graph in SPSS? The only way I can see at the moment is to manually type the calculated figures into a new dataset and graph it. That would work but doesn’t seem a very practical way of doing things if this was a large dataset instead of a small example one. Hence I’m assuming this must be a better way of doing this?
Thank you in advance for any help you can give me.
Hi Peter,
Yes, I definitely check these comments!
Unfortunately, I don’t have much experience using SPSS, so I’ll be of limited help with that. There must be some way to do that in SPSS though. Worst case scenario, calculate the percentages by hand or in Excel and then enter them into SPSS and graph them. That shouldn’t be necessary but would work in a pinch.
Perhaps someone with more SPSS experience can provide some tips?
Hi. This comment relates to Warren’s post. The null hypothesis is that there is no statistically significant relationship between “Uniform color” and “Status”. During the summing used to calculate the Chi-squared statistic, each of the (6) contributions are included. (3 Uniform colors x 2 status possibilities) The “Alive” column gives the small contributions that bring the total contribution from 5.6129 up to 6.189. Any reasoning specific to the “Dead” column only begins after the 2-dimensional Chi-squared calculation has been completed.
Hi Bill, thanks for your clarifications. I got confused with whom you were replying!
The chi-square formula is: χ2 = ∑(Oi – Ei)2/Ei, where Oi = observed value (actual value) and Ei = expected value.
Hi Bill, thanks. I do cover the formula and example calculations in my other post on the topic, How Chi-Squared Works.
Why is the Pearson Chi Square statistic not equal to the sum of the contributions to Chi-Square? I get 5.6129. The p-value for that Chi-Squre statistic is .0604 which is NOT significant in this century OR the 24th.
Thank you JIm, Excellent concept teaching!
Thank you so much for the Star Trek example! As a long-time Trek fan and Stats student, I absolutely love the debunking of the red shirt theory!
Hi Hope,
I’m so glad you liked my example. I’m a life-long Trek fan as well! I found the red shirt question to be interesting. One the one hand, part of the answer of the answer is that red shirts comprise just over 50% of the crew, so of course they’ll have more deaths. And then on the other hand, it’s only certain red shirts that actually have an elevated risk, those in security.
Got this response from the gentleman who did the calculation using a Chi Square. Would you mind commenting? “The numbers reported are nominate (counting) numbers not ordinate (measurement) numbers. As such chi-square analysis must be used to statistically compare outcomes. Two-sample student t-tests cannot be used for ordinate numbers. Correlations are also not usually used for ordinate numbers and most importantly correlations do NOT show cause and effect.”
Hi again,
I agree with the first comment. However, please note that I recommended the 2-sample proportions test and the other person is mentioning the 2-sample t-test. Very different tests! And, I agree that the t-test is not appropriate for the Pfizer data. Basically, he’s saying you have categorical data and the t-test is for continuous data. That’s all correct. And that’s why I recommended the the proportions test.
As for the other part about “correlations do NOT show cause and effect.” That’s not quite correct. More accurately, you’d say that correlations do not NECESSARILY imply causation. Sometimes they do and sometimes they don’t imply causation. It depends on the context in which the data were collected. Correlations DO suggest causation when you use a randomized controlled trial (RCT) for the experiment and data collection, which is exactly what Pfizer did. Consequently, the Pfizer data DO suggest that the vaccine caused a reduction in the proportion of COVID infections in the vaccine group compared to the control group (no vaccine). RCTs are intentionally designed so you can draw causal inferences, which is why the FDA requires them for vaccine and other medical trials.
If you’re interested, I’ve written an article about why randomized controlled trials allow you to make causal inferences.
Mr. Jim Frost…You are Da Man!! Thank you!! Yes, this is the same document I have been looking at, just did not know how to interpret Table 9. Sorry, never intended to ask you for medical advice, just wanted to understand the statistics and feel confident that the calculations were performed correctly. You have made my day! Now just a purely statistics question, assuming I have not worn out your patience with my dumb questions…Can you explain the criteria used to determine when a Chi Square should be used versus a 2-samples proportions test? I think I saw a comment from someone on your website stating that the Chi Sqaure is often misused in the medical field. Fascinating, fascinating field you are in. Thank you so much for sharing your knowledge and expertise.
Hi Chris,
You bet! That’s why I’m here . . . to educate and clarify statistics and statistical analyses!
The chi-squared test of independence (or association) and the two-sample proportions test are related. The main difference is that the chi-squared test is more general while the 2-sample proportions test is more specific. And, it happens that the proportions test it more targeted at specifically the type of data you have.
The chi-squared test handles two categorical variables where each one can have two or more values. And, it tests whether there is an association between the categorical variables. However, it does not provide an estimate of the effect size or a CI. If you used the chi-squared test with the Pfizer data, you’d presumably obtain significant results and know that an association exists, but not the nature or strength of that association.
The two proportions test also works with categorical data but you must have two variables that each have two levels. In other words, you’re dealing with binary data and, hence, the binomial distribution. The Pfizer data you had fits this exactly. One of the variables is experimental group: control or vaccine. The other variable is COVID status: infected or not infected. Where it really shines in comparison to the chi-squared test is that it gives you an effect size and a CI for the effect size. Proportions and percentages are basically the same thing, but displayed differently: 0.75 vs. 75%.
What you’re interested in answering is whether the percentage (or proportion) of infections amongst those in the vaccinated group is significantly different than the percentage of infections for those in control group. And, that’s the exact question that the proportions test answers. Basically, it provides a more germane answer to that question.
With the Pfizer data, the answer is yes, those in the vaccinated group have a significantly lower proportion of infections than those in the control group (no vaccine). Additionally, you’ll see the proportion for each group listed, and the effect size is the difference between the proportion, which you can find on a separate line, along with the CI of the difference.
Compare that more specific and helpful answer to the one that chi-squared provides: yes, there’s an association between vaccinations and infections. Both are correct but because the proportions test is more applicable to the specific data at hand, it gives a more useful answer.
I see you have an additional comment with questions, so I’m off to that one!
Hi Jim,
So sorry if my response came off as anything but appreciative of your input. I tried to duplicate your results in your Flu Vaccine article using the 2 Proportion test as you recommended. I was able to duplicate your Estimate for Difference of -0.01942, but I could not duplicate your value for Z, so clearly I am not doing the calculation correctly – even when using Z calculators. So since I couldn’t duplicate your correct results for your flu example, I did not have confidence to proceed to Moderna. I was able to calculate effectiveness (the hazard ratio that is widely reported), but as I have reviewed the EUA documents presented to the FDA in December 2020, I know that there is no regression analysis, and most importantly, no data to show an antibody response produced by the vaccine. So they are not showing the vaccine was successful in producing an immune response, just giving simplistic proportions of how many got covid and how many didn’t. And as they did not even factor in the number of people who had had covid prior to vaccine, I just cant understand how these numbers have any significance at all. I mention the PCR test because it too is under an EUA, and has severe limitations. I would think that those limitations would be statistically significant, as are the symptoms which can indicate any bacterial or viral infection. And you state “I’m sure you can find a journal article or documentation that shows the thorough results if you’re interested”. Clearly I am VERY interested, as I love my parents more than life itself, and have seen the VAERS data, and I don’t want them to be the next statistic. But I CANT find the thorough results that you say are so easy to find. If I could I would not be trying to learn to perform statistical calculations. So I went out on a limb, as you are a fellow trekky and seem like a super nice guy, sharing your expertise with others, and thought you might be able to help me understand the statistics so I can help my parents make an informed choice. We are at a point that children and pregnant women are getting these vaccines. Unhealthy, elderly people in nursing homes (all the people excluded in the trials) are getting these vaccines. I simply ask the question…..do these vaccines provide more protection than NOT getting the vaccine? The ENTIRE POPULATION is being forced to get these vaccines. And you tell me “I’m sure you can find a journal article or documentation that shows the thorough results if you’re interested.” I can only ask…how are you NOT interested? This is the most important statistical question of our lifetime, and of your children’s and granchildren’s lifetime. And I find that no physician or statistician able or willing to answer these questions.
Respectfully, Chris
Hi Chris,
No worries. On my website, I’m just discussing the statistical nature of Moderna’s study. Of course, everyone is free to make their own determination and decide accordingly.
I did a quick Google search and found the Moderna COVID Vaccine BRBPAC briefing document. That’s the FDA briefing document. It’s long as you’d expect. You can see the results in the executive summary. And, I’m looking at Table 9 on page 23 that focuses on vaccine efficacy. They list the Vaccine Efficacy and, importantly, the confidence intervals by age group. Because the CIs exclude zero, the results are statistically significant. Also, note in the double asterisk section (**) below the table that they use the stratified Cox proportional hazard model and obtained a p-value of < 0.0001. That is very significant. Additionally, I'm not sure how you analyzed the Pfizer data. I entered those numbers in my statistical software and ran a 2-sample proportions test and obtained a p-value of 0.000, which is very significant. I'm including the image below.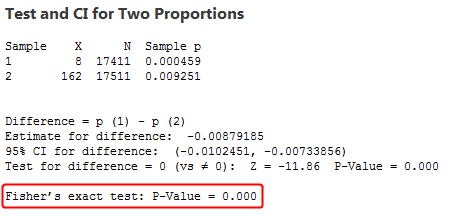
You’re obviously free to question the methods and analysis, but as a statistician, I’m satisfied that Moderna performed an appropriate clinical trial and followed that up with a rigorous and appropriate statistical analysis. In my opinion, they have demonstrated that their vaccine is safe and effective. The only caveat is that we don’t have long-term safety data because not enough time has gone by. However, most side effects for vaccines show up in the first 45 days. That timeframe occurred during the trial and all side effects were recorded.
However, I’m not going to get into a debate about whether anyone should get the vaccine or not. I run a statistics website and that’s the aspect I’m focusing on. There are other places to debate the merits of being vaccinated.
Hi Jim, thanks for the reply. I have to admit the detail of all the statistical methods you mention are over my head, but by scanning the document it appears you did not actually calculate the vaccine’s efficacy, just stated how the analysis should be done. I am referring to comments like “To analyze the COVID-19 vaccine data, statisticians will use a stratified Cox proportional hazard regression model to assess the magnitude of the difference between treatment and control groups using a one-sided 0.025 significance level”. And “The full data and analyses are currently unavailable, but we can evaluate their interim analysis report. Moderna (and Pfizer) are still assessing the data and will present their analyses to Federal agencies in December 2020.” I am looking at the December 2020 reports that both Pfizer and Moderna presented to the FDA, and I see no “stratified Cox proportional hazard regression model”, just the simplistic hazard ratio you mention in your paper. I don’t see how that shows the results are statistically significant and not chance. Also the PCR test does not confirm disease, just presence of virus (dead or alive) and virus presence doesnt indicate disease. And the symptoms are symptoms of any viral or bacterial infection, or cancer. Just sort of suprised to see no statistical analysis in the December 2020 reports. Was hoping you had done the heavy lifting…lol
Hi Christine,
You had asked if Chi-square would work for your data and my response was no, but here are two methods that would. No, I didn’t analyze the Moderna data myself. I don’t have access to their complete data that would allow me to replicate their results. However, in my post, I did calculate the effectiveness, which you can do using the numbers I had, but not the significance.
Based on the data you indicated you had, I’d recommend the two-sample proportions test that I illustrate in the flu vaccine post. That won’t replicate the more complex analyses but is doable with the data that you have.
The Cox proportional hazard regression model analyzes the hazard ratio. The hazard ratio is the outcome measure in this context. They’re tied together and it’s the regression analysis that indicate significance. I’d imagine you’d have to read a thorough report to get the nitty gritty details. I got the details of their analysis straight from Moderna.
I’m not sure what your point with the PCR test. But, I’m just reporting how they did their analysis.
Moderna, Pfizer, and the others have done the “heavy lifting.” When I wrote the post about the COVID vaccination, it was before it was approved for emergency use. By this point, I’m sure you can find a journal article or documentation that shows the thorough results if you’re interested.
Hi Jim, my parents are looking into getting the Pfizer vaccine, and I was wondering if I could use a chi square analysis to see if its statistically effective. From the EUA document, 17411 people got the Pfizer vaccine, and of those people – 8 got covid, and 17403 did not. Of the control group of 17511 that did not get the vaccine, 162 got covid, and 17349 did not. My calculations show this is not statistically significant, but wasn’t sure if I did my calculation correctly, or if I can even use a chi square for this data. Can you help? PS. As a Trekky family, I love your analysis…but we all know its the new guy with a speaking part that gets axed…lol
Hi Christine,
There are several ways you can analyze the effectiveness. I write about how they assessed the Moderna vaccine’s effectiveness, which uses a special type of regression analysis.
The other approach is to use a two-sample proportions test. I don’t write about that in the COVID context but I show how it works for flu vaccinations. The same ideas apply to COVID vaccinations. You’re dealing comparing the proportion of infections in the control group to the treatment group. Hence, a two-sample proportions test.
A chi-square analysis won’t get you where you want to go. It would tell you if there is an association, but it’s not going to tell you the effect size.
I’d read those two posts that I wrote. They’ll give you a good insight for possible ways to analyze the data. I also show how they calculate effectiveness for both the COVID and flu shots!
I hope that helps!
Hi Jim,
thank you so much for your response and advice!
I will probably go for the logistic regression then 🙂
All the best for you!
You’re very welcome! Best of luck with your study! 🙂
Hi Jim,
thank you so much for your quick response! This actually helps me a lot and I also already thought about doing a binary logistic regression. However, my supervisor wanted me to use a chi-square test, as he thinks it is easier to perform and less work. So now I am struggling to decide, which option would be more feasible.
Coming back to the chi-square test – could I create a new variable which differentiates between the four experimental conditions and use this as a new ID? Or can I use the DV to weight the frequencies in the chi-square test? – I did that once in a analysis using a continuous DV as weight. Yet, I am not sure if or how that works with a binary variable. Do you have an idea what would work best in the case of a chi-square test?
Thank you so much!!
Best, Anni
Hi Anni,
You’re very welcome!
I don’t think either binary logistic regression or chi-square are more less work than the other. However, Chi-square won’t give you the answers you want. You can’t do interaction effects with chi-square. You won’t get nice odds ratios which are a much more intuitive way to interpret the results than chi-square, at least in my opinion. With chi-square, you don’t get a p-value/significance for each variable, just the overall analysis. With logistic regression, you get p-values for each variable and the interaction term if you include it.
I think you can do chi-square analyses with more than one independent variable. You’d essentially have a three dimensional table rather than a two-dimensional table. I’ve never done that myself so I don’t have much advice to offer you there. But, I strongly recommend using logistic regression. You’ll get results that are more useful.
Hi Jim,
thank you so much for this helpful post!
Hi Jim,
thank you for this very helpful post.
Currently, I am working on my master’s thesis and I am struggling with identifying the right way to test my hypothesis as in my case I have three dummy variables (2 independent and 1 dependent).
The experiment was on the topic advice taking. It was a 2×2 between sample design manipulating the source of advice to be a human (0) or an algorithm (1) and the task to be easy (0) or difficult (1). Then, I measured whether the participants followed (1) or not followed (0) the advice. Now, I want to test if there is an interaction effect. In the easy task I expect that the participants rather follow the human advice and in the difficult task the participants rather follow the algorithmic advice.
I want to test this using a chi-square independence test, but I am not sure how to do that with three variables. Should I rather use the variable “Follow/Notfollow” as a weight or should I combine two of the variables so that I have a new variable with four categories, e.g. Easy.Human, Easy.Algorithm, Difficult.Human, Difficult.Algorithm or Human.Follow, Human.NotFollow, Algorithm.Follow, Algorithm.NotFollow
I am not sure, if this is scientifically correct. I would highly appreciate your help and your advice.
Thank you so much in advance!
Best, Anni
Hi Anni,
I think using binary logistic regression would be your best bet. You can use your dummy DV with that type. And have two dummy IVs also works. You can also include an interaction term, which isn’t possible in chi-square tests. This model would tell you whether source of advice, difficulty of task, and their interaction relate to the probability of participants following the advice.
I hope that helps!
Hi Jim, I want to thank you for all the content that you have posted online. It has been very helpful for me to apply simple principles of statistics at work. I wanted your thoughts on how to approach the following problem, which appeared to be slightly different from the examples that you shared above.
We have two groups – test group (exposed to an ad for brand A) and control group (not exposed to any ads for brand A).
We asked both groups a qn: Have you heard of brand A? The possible answers were a Y/N. We then did a t-test to determine if the answers were significantly different for the test and control groups (they were)
We asked both groups a follow-up qn as well:
How likely are you to buy any of the following brands in the next 3 months? The options were as follows (any one could be picked. B,C & D are competing brands with A)
1.A 2.B 3.C 4.D
We wanted to check if the responses we received from both groups were statistically different. Based on my reading, it seemed like the Chi-Square test was the right one to run here. However, I wasn’t too sure what the categorical variables would be in this case and how we could run the Chi-square test here.
Would like to get our inputs on how to approach this.
Thanks
Hi Jacob,
For the first question, I’d typically recommend a 2-sample proportions test. You have two groups and the outcome variable is binary, which is good for proportions. Using a 2-sample proportions test will tell you whether the proportion of individuals who have heard of Brand A differs by the two groups (ads and no ads). You could use the chi-squared test of independence for this case but I recommend the proportions test because it’s designed specifically for this scenario. The procedure can also estimate the effect size and a CI for the effect size (depending on your software). A t-test is not appropriate for these data.
For the next question, yes, the chi-square test is good choice as long as they can only pick one of the options. Maybe, which brand are you most likely to purchase in the next several months. The categories must be mutually exclusive to use chi-square. One variable could be exposed to ad with yes and no as levels. The other would be the purchase question with A, B, C, D as levels. That gives you a 2 X 4 table for your chi-squared test of independence.
I hope that helps!
I don’t see the relationship between the table of shirt color and status and the tabulated statistics. Sam
Hi Sam,
I show the relationship several ways in this post. The key is to understand how the actual counts compare to the expected counts. The analysis calculates the expected counts under the assumption that there is no relationship between the variables. Consequently, when there are differences between the actual and expected accounts, a relationship potentially exists.
In the Tabulated Statistics output, I circle and explain how the actual counts compare to the expected counts. Blue uniforms have fewer deaths than expected while Gold uniforms have more deaths than expected. Red uniforms equal the expect amount, although I explore that in more detail later in the post. You can also see these relationships in the graph titled Percentage of Fatalities.
Overall, the results show the relationship between uniform color and deaths and the p-value indicates that this relationship is statistically significant.
I hope that helps!
Suppose you have two variables that checking out books and means to get to the central library. How might you formulate null hypothesis and alternative hypothesis for the independence test?
please answer anyone
Hi Bijoya,
In this case, the null hypothesis states that there is no relationship between means to get to the library and checking out a book. The alternative hypothesis states that there is a relationship between them.
Hi there I’m just wondering if it would be appropriate to use a Chi square test in the following scenario;
– A data set of 1000 individuals
– Calculate Score A for all 1000 individuals; results are continuous numerical data eg. 2.13, 3.16, which then allow individuals to be placed in categories; low risk (3.86)
-Calculate Score B for the same 1000 individuals; results are discrete numerical data eg. 1, 6, 26 ,4 which the allow individuals to be placed in categories; low risk (26).
– I then want to compared the two scoring systems A & B ; to see if (1) the individuals are scoring similarly on both scores (2) I have reason to believe one of the scores overestimates the risk, I’d like tot test this.
Thank you, I haven’t been able to find any similar examples and its stressing me out 🙁
Hi Jim,
Would you be able to advise?
My organization is sending out 6 different emails to employees, in which they have to click on a link in the email. We want to see if one variation in language might get a higher click rate rate for the link. So we have 6 between subjects conditions, and the response can either be a ‘clicked on the link’ or ‘NOT clicked on the link’.
Is this a Chi-Square of Independence test? Also, how would I know where the difference lies, if the test is significant? (i.e., what is the non-parametric equivalent of running an ANOVA and followup pairwise comparisons?
Thanks Jim!
I am working on the press coverage of civil military relations in Pakistani press from 2008 to 2018, I want to check that whether is a difference of coverage between two tenures ie 2008 to 2013 and 2013 to 2018. Secondly I want to check the difference of coverage between two types of newspapers ie english newspapers and urdu newspapers. furthermore I also want to check the category wise difference of coverage from the tenure 2008 to 2018.
I have divided my data into three different distributions, 1 is pro civilian, 2 is pro military and 3 is neutral.
Hi thank you so much for this. I would like to ask, if the study Is about whether factors such as pricing, marketing, and brand affects the intention of the buyer to purchase the product. Can I use Chi-test for the statistic treatment? and if it is not can I ask what statistical treatment would you suggest? Thank you so much again.
Jim,
Thank you for the post. You displayed a lot of creativity linking the two lessons to Star Trek. Your website and ebook offerings are very inspiring to me.
Bill
Thanks so much, Bill. I really appreciate the kind words and I’m happy that the website and ebooks have been helpful!
Thank-you for your explanation. I am trying to help my son with his final school year investigation. He has raw data which he collected from 21 people of varying experience. They all threw a rugby ball at a target and the accuracy, time of ball in the air and experience (rated from 1-5) were all recorded. He has calculated the speed and the displacement, and used correlation to compare speed versus accuracy and experience versus accuracy. He needs to incrementally increase the difficulty of maths he uses in his analysis and he was thinking of the Chi Square test as a next step, however from your explanation above the current form of his data would not be suitable for this test. Is there a way of re-arranging the data so that we can use the Chi Square test? Thanks!
Hi Rhonwen,
The chi-squared test of independence looks for correlation between categorical variables. From your description, I’m not seeing a good pair of categorical variables to test for correlation. To me, the next step for this data appears to be regression analysis.
Hi Jim,
Thank you for the detailed teaching! I think this explains chi square much better than other websites I have found today. Do you mind sharing which software you use to get Expected Count and contribution to Chi square? Thank you for your help.
Good day jim!
I was wondering what kind of data analysis should i use if i am going to have a research on knowledge, attitude and practices?
Looking forward to your reply!
Thank you!
Very informative and easy to understand it.
Thank you so much sir
Hi
I wanted to know how the significance probability can be calculated if the significance level wasn’t given.
Thank you
Hi, you don’t need to know the significance level to be able to calculate the p-value. For calculating the p-value, you must know the null hypothesis, which we do for this example.
However, I do use a significance level of 0.05 for this example, making the results statistically significant.
What summary statistics can I use to describe the graph of a categorical data? Good presentation by the way. Very Insightful
Hi Michael,
For categorical data like the type in this example, which is in a two-way contingency table, you’d often use counts or percentages. A bar chart is often a good choice for graphing counts or percentages by multiple categories. I show an example of graphing data for contingency tables in my Introduction to Statistics ebook.
Thank you for your answer. I saw online that bar graphs can be used to visualise the data (I guess it would be the percentage of death in my case) with 95% Ci intervals for the error bar. Is this also applicable if I only have a 2×2 contingency table? If not, what could be my error bar?
Hi John, you can obtain CIs for proportions, which is basically a percentage. And, bar charts are often good for graphing contingency tables.
Hi! So I am working on this little project where I am trying to find a relationship between sex and mortality brought by this disease so my variables are: sex (male or female) and status (dead or alive). I am new to statistics so I do not know much. Is there any way to check the normality of categorical data? There is a part wherein our data must be based on data normality but I am not sure it this applies to categorical data. Thank you for your answer!
Hi John,
The normal distribution is for continuous data. You have discrete data values–two binary variables to be precise. So, the normal distribution is not applicable to your data.
Hi Jim, this was really helpful. I am in the midst of my proposal on a research to determine the association between burnout and physical activity among anaesthesia trainees.
They are both categorial variable
physical activity – 3 categories: high, moderate, low
burnout – 2 categories: high and low
How do I calculate my sample size for my study?
Hi Jaishree,
I suggest you download a free sample size and power calculation program called G*Power. Then do the following:
Experiment and adjust values to see how that changes the output. You want to find a sample size that produces sufficient power while incorporating your best estimates of the other parameters (effect size, etc.).
Learned so much from this post!! This was such a clear example that it is the first time for me that some statistic tests really make sense to me.
Thank you so much for sharing your knowledge, Jim!!
Hello,
the information that you have given here has been so useful to me – really understand it much better now. So, thank you very much!
Just a quick question, how did you graph the contribution to chi-square statistics? Only, I’ve been using stata to do some data analysis and I’m not sure how it is that I would be able to create a graph like that for my own data. Any insight into that, that you can give would be extremely useful.
Hi Daisy,
I used Minitab statistical software for the graphs. I think graphs often bring the data to life more than just a table of numbers.
Hi, Jim.
I have the results of two Exit Satisfaction Surveys related to two cohorts (graduates of 2017-18 and graduates of 2018-19). The information I received was just the “number” of ratings on each of the 5 points on the Likert Scale (e.g., 122 respondents Strongly Agreed to a given item). I changed the raw ratings into percentages for comparison, e.g., for Part A of the Survey (Proficiency and Knowledge in my major field), I calculated the minimum and maximum percentages on the Strongly Agree point and did the same for other points on the scale. My questions are (1) can I report the range of percentages on each point on the scale for each item or is it better to report an overall agreement/disagreement? and (2) what’s the best statistics to compare the satisfaction of the two cohorts in the same survey? The 2017-18 cohorts included 126, and the 2018-19 cohort included 296 graduates.
I checked out your Introduction to Statistics book that I purchased, but I couldn’t decide about the appropriate statistics for the analysis of each of the surveys as well as comparison of both cohorts.
My sincere thanks in advance for your time and advice,
All the best,
Ellie
Thank you for an excellent post! I am myself will soon perform a Chi-square test of independence on survey responses with two variables, and now think it might be good to start with a 2 proportion test (is a Z-test with 2 proportions what you use in this example?). Since you don’t discuss whether the Star Trek data meets the assumptions of the two tests you use, I wonder if they share approximately the same assumptions? I have already made certain that my data may be used with the Chi-square (my data is by the way not necessarily normally distributed, and has unkown mean and variance), can I therefore be comfortable with using a 2 proportions Z-test too? I hope you have the time to help me out here!
Excellent post. Btw, is it similar to what they called Test of Association that uses contingency table? The way they compute for the expected value is (row total × column total)/(sample total) . And to check if there is a relationship between two variable, check if the calculate chi-squared value is greater that the critical value of the chi-squared. Is it just the same?
Hi Hephzibah,
Yes, they’re the same test–test of independence and test of association. I’ll add something to that effect to the article to make that more clear.
Jim, thanks for creating and publishing this great content. In the initial chi-square test for independence we determined that shirt color does have a relationship with death rate. The Pearson ch-square measurement is 6.189, is this number meaningful? How do we interpret this in plain english?
Hi Michael,
There’s really no direct interpretation of the chi-square value. That’s the test statistic, similar to the t-value in t-tests and the F-value in F-tests. These values are placed in the chi-square probability distribution that has the specified degrees of freedom (df=2 for this example). By placing the value into the probability distribution, the procedure can calculate probabilities, such as the p-value. I’ve been meaning to write a post that shows how this works for chi-squared tests. I show how this works for t-tests and F-tests for one-way ANOVA. Read those to get an idea of the process. Of course, for this chi-squared test uses chi-squared as the test statistic and probability distribution.
I’ll write a post soon about how this test works, both in terms of calculating the chi-square value itself and then using it in the probability distribution.
Would Chi-squared test be the statistical test of choice, for comparing the incidence rates of disease X between two states? Many thanks.
Hi Michaela,
It sounds like you’d need to use a two-sample proportions test. I show an example of this test using real data in my post about the effective of flu vaccinations. The reason you’d need to use a proportions test is because your observed data are presumably binary (diseased/not diseased).
You could use the chi-squared test, but I think for your case the results are easier to understand using a two-sample proportions test.
Jim,
Lets say the expected salary for a position is 20,000 dollars. In our observed salary we have various figures a little above and below 20,000 and we want to do a hypothesis test. These salaries are ratio, so does that mean we cannot use Chi Square? Do we have to convert? How? In fact, when you run a chi square on the salary data Chi Square turns out to be very high, sort of off the Chi Square Critical Value chart.
thanks
Lou
Hi Louis,
Chi-square analysis requires two or more categorical (nominal) variables. Salary is a continuous (ratio) variable. Consequently, you can’t use chi-square.
If you have the one continuous variable of salary and you want to determine whether the difference between the mean salary and $20,000 is statistically significant or not, you’d need to use a one-sample t-test. My post about the different forms of t-tests should be helpful for you.
Jim,
I don’t know how to thank you for your detailed informative reply. And I am happy that a specialist like you found this study interesting yoohoo 🙂
As to your comment on how we (me and my graduate student whose thesis I am directing) tracked the errors from Sample writing 1 to 5 for each participant, We did it manually through a close content analysis. I had no idea of a better alternative since going through 25 pieces of writing samples needed meticulous comparison for each participant. I advised my student to tabulate the number, frequency, and type of errors for each participant separately so we could keep track of their (lack of) improvement depending on the participant’s proficiency level.
Do you have any suggestion to make it more rigorous?
Very many thanks,
Ellie
Hi, Jim. I first decided to choose chi-square to analyze my data but now I am thinking of poisson regression since my dependent variable is ‘count.’. I want to see if there is any significant difference between Grade 10 students’ perceptions of their writing problems and the frequency of their writing errors in the five paragraphs they wrote. Here is the detailed situation:
1. Five sample paragraphs were collected from 5 students at 5 proficiency levels based on their total marks in English final exam in the previous semester (from Outstanding to Poor).
2. The students participated in an interview and expressed their perceptions of their problem areas in writing.
3. The students submitted their paragraphs every 2 weeks during the semester.
4. The paragraphs were marked based on the school’s marking rubrics.
5. Errors were categorized under five components (e.g., grammar, word choice, etc.).
6. Paragraphs were compared for measuring the students’ improvement by counting errors manually in each and every paragraph.
7. The students’ errors were also compared to their perceived problem areas to study the extent of their awareness of their writing problems. This comparison showed that students were not aware of a major part of their errors while their perceived errors were not necessarily observed in their writing samples.
8. Comparison of Paragraphs 1 and 5 for each student showed decrease in the number of errors in some language components while some errors still persisted.
9. I’m also interested to see if proficiency level has any impact on students’ perceptions of their real problem areas and the frequency of their errors in each language category.
My question is which test should be used to answer Qs 7 and 8?
As to Q9, one of the dependent variables is count and the other one is nominal. One correlation I’m thinking is eta squared (interval-nominal) but for the proficiency-frequency I’m not sure.
My sincere apologies for this long query and many thanks for any clues to the right stats.
Ellie
Hi Ellie,
That sounds like a very interesting study!
I think that you’re correct to use some form of regression rather than chi-square. The chi-squared test of independence doesn’t work with counts within an observation. Chi-squared looks at the multiple characteristics of an observations and essentially places in a basket for that combination. For example, you have a red shirt/dead basket and a red-shirt/alive basket. The procedure looks at each observation and places it into one of the baskets. Then it counts the observations in each basket.
What you have are counts (of errors) within each observation. You want to understand that IVs that relate to those counts. That’s a regression thing. Now, what form of regression. Because it involves counts, Poisson regression is a good possibility. You might also read up on negative binomial regression, which is related. Sometimes you can have count data that doesn’t meet certain requirements of the Poisson distribution, but you can use Negative Binomial regression. For more information, look on page 321-322 of my ebook that you just bought! 🙂 I talk a bit about regression with counts.
And, there’s a chance that you might be able to use OLS regression. That depends on how you’re handling the multiple assessments and the average number of errors. The Poisson distribution begins to approximate the normal distribution at around a mean of 25-ish. If the number of errors tend to fall around here or higher, OLS might be the ticket! If you’re summing multiple observations together, that might help in this regard.
I don’t understand the design of how you’re tracking changing the number of errors over time, and how you’ll model that. You might included lagged values of errors to explain current errors, along with other possible IVs.
I found point number 7 to be really interesting. Is it that the blind spot allows the error to persist in greater numbers and that awareness of errors had reduced numbers of those types? Your interpretation of that should be very interesting!
Oh, and for the nominal dependent variable, use nominal logistic regression (p. 319-320)!
I hope this helps!
Thanks for your clear posts, Could you please give some insight like in T test and F test, how can we calculate a chi- square test statistic value and how to convert to p value?
Hi Gopi,
I have that exact topic in mind for a future blog post! I’ll write one up similar to the t-test and F-test posts in the near future. It’s too much to do in the comments section, but soon an entire post for it! I’ll aim for sometime in the next couple of months. Stay tuned!
This was great. 🙂
thanks i have learnt alot
Hello, Thanks for the nice tutorial. Can you please explain how the ‘Expected count’ is being calculated in the table “tabulated statistics: Uniform color, Status” ?
Hi Shihab, that’s an excellent question!
You calculate the expected value for each cell by first multiplying the column proportion by the row proportion that are associated with each cell. This calculation produces the expected proportion for that cell. Then, you take the expected proportion and multiply it by the total number of observations to obtain the expected count. Let’s work through an example!
I’ll calculate the expected value for wearing a Blue uniform and being Alive. That’s the top-left cell in the statistical output.
At the bottom of the Alive column, we see that 90.7% of all observations are alive. So, 0.907 is the proportion for the Alive column. The output doesn’t display the proportion for the Blue row, but we can calculate that easily. We can see that there are 136 total counts in the Blue row and there are 430 total crew members. Hence, the proportion for the Blue row is 136/430 = 0.31627.
Next, we multiply 0.907 * 0.31627 = 0.28685689. That’s the expected proportion that should fall in that Blue/Alive cell.
Now, we multiply that proportion by the total number of observations to obtain the expected count for that cell:
0.28685689 * 430 = 123.348
You can see in the statistical output that has been rounded up to 123.35.
I hope this helps!
You simply repeat that procedure for the rest of the cells.
very nice, thanks
Amazing post!! In the tabulated statistics section, you ran a Pearson Chi Square and a Likelihood Ratio Chi Square test. Are both of these necessary and do BOTH have to fall below the significance level for the null to be rejected? I’m assuming so. I don’t know what the difference is between these two tests but I will look it up. That was the only part that lost me:)
Thanks again, Jessica! I really appreciate your kind words!
When the two p-values are in agreement (e.g., both significant or insignificant), that’s easy. Fortunately, in my experience, these two p-values usually do agree. And, as the sample size increases, the agreement between them also increases.
I’ve looked into what to do when they disagree and have not found any clear answers. This paper suggests that as long as all expected frequencies are at least 5, use the Pearson Chi-Square test. When it is less than 5, the article recommends an adjusted Chi-square test, which is neither of the displayed tests!
These tests are most likely to disagree when you have borderline results to begin with (near your significance level), and particularly when you have a small sample. Either of these conditions alone make the results questionable. If these tests disagree, I’d take it as a big warning sign that more research is required!
I hope this helps!
Nice post.
Thank you!
A good presentation. My experience with researchers in health sciences and clinical studies is that very often people do not bother about the hypotheses (null and alternate) but run after a p-value, more so with Chi-Square test of independence!! Your narration is excellent.
Helpful post. I can understand now
Excellent Example, Thank you.
You’re very welcome. I’m glad it was helpful!