Nonlinear regression is an extremely flexible analysis that can fit most any curve that is present in your data. R-squared seems like a very intuitive way to assess the goodness-of-fit for a regression model. Unfortunately, the two just don’t go together. R-squared is invalid for nonlinear regression.

Some statistical software calculates R-squared for these models even though it is statistically incorrect. Consequently, it’s important that you understand why you should not trust R-squared for models that are not linear. In this post, I highlight research that shows you how assessing R-squared for nonlinear regression causes serious problems and leads you astray.
Why Is R-squared Valid for Only Linear Regression?
In my post about how to interpret R-squared, I explain how R-squared is the following proportion:
![]()
Furthermore, the variances always add up in a particular way:
Explained variance + Error variance = Total variance.
This arrangement produces an R-squared that is always between 0 – 100%.
That all makes sense, right? For linear models, this works out as you expect.
However, this math works out correctly only for linear regression models. In nonlinear regression, these underlying assumptions are incorrect. Explained variance + Error variance DO NOT add up to the total variance! The result is that R-squared isn’t necessarily between 0 and 100%. There are other problems with it as well.
This problem completely undermines R-squared in the context of nonlinear regression.
Keep in mind that I’m referring specifically to nonlinear models. R-squared is valid for linear regression models that use polynomials to model curvature. If you’re not clear about the difference between these two types of models, read my post to learn how to distinguish between linear and nonlinear regression.
Specific Problems of Using R-squared with Nonlinear Regression
The general mathematic framework for R-squared doesn’t work out correctly if the regression model is not linear. Despite this issue, most statistical software still calculates R-squared for nonlinear models. This questionable practice can cause problems for you. Let’s see the ramifications!
Spiess and Neumeyer* performed a simulation study to look at the effect of using R-squared to assess the goodness-of-fit for models that are not linear. Their study ran thousands of simulations and found that R-squared leads you to draw false conclusions about which nonlinear models are best.
If you use R-squared for nonlinear models, their study indicates you will experience the following problems:
- R-squared is consistently high for both excellent and appalling models.
- R-squared will not rise for better models all of the time.
- If you use R-squared to pick the best model, it leads to the proper model only 28-43% of the time.
If you take all of these together, R-squared can’t differentiate between good and bad nonlinear models. It just doesn’t work. The authors go on to disparage the continuing practice of statistical software to calculate R-squared for nonlinear regression:
In the field of biochemical and pharmacological literature there is a reasonably high occurrence in the use of R2 as the basis of arguing against or in favor of a certain model. . . . Additionally, almost all of the commercially available statistical software packages calculate R2 values for nonlinear fits, which is bound to unintentionally corroborate its frequent use. . . . As a result from this work, we would like to advocate that R2 should not be reported or demanded in pharmacological and biochemical literature when discussing nonlinear data analysis.
If your statistical software calculates R-squared for nonlinear models, don’t trust it!
There are other goodness-of-fit measures you can use for regression models that are not linear. For instance, you can use the standard error of the regression. For this statistic, smaller values represent better models.
If you’re learning regression, check out my Regression Tutorial!
Reference
Spiess, Andrej-Nikolai, Natalie Neumeyer. An evaluation of R2 as an inadequate measure for nonlinear models in pharmacological and biochemical research: a Monte Carlo approach. BMC Pharmacology. 2010; 10: 6.

Dear Mr Frost,
Thank you for your article, it is really enlightening. I just have a question regarding the reference you used. According to the paper, the residual variance (very similar to MSE) is just as bad as the R2. That said, is it really OK to use RMSE to measure a model performance? The non-linear model I am using is called Gradient Boosting Machine (clearly highly non linear).
Thank you very much,
Rodrigo
Hi Rodrigo,
I always recommend using the standard error of the regression (S), which is the square root of the adjusted mean square error. The adjustment is the same as adjusted R-squared, which is based on the number of predictors. Using either adjusted R-squared or the standard error of the regression, it’s possible to add predictors and obtain a worse fit. In that way, S is better than R-squared. And, it’s valid to use in nonlinear regression.
Below is the equation for the adjusted mean squared error. Take the square root of it to obtain the standard error of the regression (S).
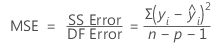
Where n is the number of observations and p is the number of coefficients in the model not counting the constant.
I hope that helps!
Can you please elaborate this statement”Explained variance + Error variance DO NOT add up to the total variance! The result is that R-squared isn’t necessarily between 0 and 100%.”
And explain why this condition doesn’t hold true for non-linear curves.
Hi, thanks for your article. You say that “it would not be appropriate for…the exponential relationship”, but if you take the LN value of each, would you say the trendline of the resultant function is valid because it’s linear?
The R-squared values can be generated using LINEST and LOGEST for the LN value of the exponential and the exponential itself, respectively, and are, unsurprisingly, the same.
Hi Jim,
Very intuitive blog. The definition of linear model and nonlinear model is very impressive. I have two questions:
1) My regression model is y = a*x + b + c*sin(x) + d*cos(x) + e*sin(2*x) + f*cos(2*x). I think it is a linear model and I can calculate R^2 and the p-value to test the if (a*x) makes a significant contribution to the regression, right?
2) You mentioned “it would not be appropriate for, say, the exponential relationship”. What does it mean? I think y = a*x + b + c*(2^x) is still a linear model. If I am wrong, could you explain why?
Thank you for your blog. It helps me a lot!
Hi Jim
Many many years ago I was aware that R^2 was incorrect for non-linear modelling in Microsoft excel.
I proved it for myself by calculating co-ordinates from an equation and asking excel to draw the graph and add the ‘trendline’ (proper spelling Trend Line) equation plus R^2. And R^2 was 1.
Fast forward many years… The same test now gives me R^2 ≠ 1 (100% of the data points on the Trend Line).
And this is the case for all curves. Do Microsoft know something we don’t?
John.
Hi John,
I’m not sure what happened with your “not equals” but I edited your comment to reflect what you meant.
So, first, I need to address one potentially confusing issue. There is the statistical definition for nonlinear and then the more common one that just means not straight. Some of the Excel trend lines fit a curve but aren’t strictly nonlinear (e.g., polynomials). R-squared is valid for those types of curvilinear relationships. However, it would not be appropriate for, say, the exponential relationship. I’m not sure which relationship you used, but as I point out in this post, many statistical software packages inappropriately display R-squared for truly nonlinear relationships, which causes a variety of problems.
If you’re talking a curvilinear relationship that isn’t nonlinear in the statistical sense, then I’m not sure.
First, I’m assuming you’re using the same data for then and now? What’s the R-squared now? Is it close to 1?
Perhaps Excel’s rounding algorithm has changed slightly over the years and before it rounded a very high R-squared (e.g., 0.9999) up to 100% but now it’s not? On the other hand, if the points are exactly on the trend line, I’m not sure why R-squared would be less than 100%. Again, I wonder if it’s perhaps a rounding issue the other way? Perhaps the exact value of a data point goes out to a number of decimal places and the rounded value isn’t quite on the trend line. I don’t know for sure, but I’d guess something along those lines if your R-squared now is very close to but not quite equal to 1.
Hi Jim,
I agree with the fact that the mathematics of OLS R-squared do not apply to nonlinear models, i.e., explained variance + error variance != total variance. Having said that, my point is that using R-squared to measure Machine Learning models quality on training data is misguided, since that data is used for fitting the model parameters. Models should be able to generalize to new examples and to test that you need to measure R-squared (or any other metric) on (left-out) test data. If you do this, then R-squared is as valid a metric as any other to evaluate any regressor performance and indeed takes values from negative infinity to 1 (as models can be arbitrarily worse predictors than an intercept model). Indeed, computing p-values in this case is probably not valid, but R-squared (1 – SSresidual / SStotal) in itself still makes sense to compute in order to compare models performance (in addition to other metrics).
Hi Franciso,
So, yes, regarding that new point that you’re making, I do agree with it. But, that’s a separate issue than whether R-squared is valid for nonlinear regression–it’s not.
For making predictions, I agree that R-squared is of limited usefulness. I talk about this in several of my blog posts:
Adjusted and Predicted R-squared: Predicted R-squared does as you describe. It assesses how it fits data points not included in the model. It might technically extend from negative infinity to 1. However, when it is a negative value, it’s usually just a bit below zero.
R-squared versus the standard error of the regression (S): S is better for assessing the accuracy of precisions than R-squared.
Understanding Precision in Prediction: I write about using prediction intervals for assessing precision of predictions. Also discuss the illusion of precision that can occur when using models.
And, in Overfitting, where high R-squared values actually indicate a problem relating to the generalizability of your model to new observations.
So, that’s been a favorite topic of mine!
Hey Jim,
I think this short article is misleading, especially when considering the use of R squared in the context of machine learning evaluation. You cite a paper that basically evaluates the ability of the R squared metric to select the “best” model based on its computation over the TRAINING DATA.
When considering an arbitrary regressor, evaluating it on the TESTING DATA, R squared can always range from negative infinity to 1, as the variance between model predictions and true values can be arbitrarily bad. Therefore, since you (and the paper you cite) don’t even consider these facts, saying that “R squared is not valid for nonlinear regression” is definitely misleading.
If you consider a nonlinear regressor trained on a set of data, then you can definitely evaluate its goodness of fit by computing R squared on a left-out test set of data. Sure, you can also compute RMSE and look at residual plots, but I fail to see a good argument for rejection of R squared for nonlinear models. Indeed, R squared is agnostic to what model is being evaluated, it simply compares predicted values with true values and a truth average.
I’d be happy to know your thoughts on this.
Hi Francisco,
I think the article makes some great points and I agree with it. First off, let me clarify that I’m referring to truly nonlinear models in the statistical meaning. However, if you’re using something like polynomials in linear regression to model curvature, that’s still a linear model in the statistical sense. R-squared is perfectly fine in that case. I have a post that describes the difference between linear and nonlinear regression in the statistical sense.
First, a couple of clarifications. R-squared is always between 0 and 100%, it does not extend down to negative infinity. Yes, R-squared is generally used to describe how well the model fits your dataset. There are other methods for validating your results with another dataset. Additionally, you can use predicted R-squared to determine how well the model fits new observations. But, that’s a separate matter from R-squared and nonlinear regression.
When you’re talking about a nonlinear model, I agree with the article that R-squared is invalid. R-squared is a measure that was developed in the context of OLS. And based on that context, Explained variance + Error variance = Total variance. That makes sense mathematically and intuitively. However, in nonlinear regression that does not hold true. R-squared was not designed for nonlinear model and doesn’t work out mathematically in that context. It’s mathematically invalid and, therefore, not valid to say it is “agnostic” about the type of model.
Furthermore, the article goes beyond just showing how it is invalid mathematically. In their simulation study, they ran thousands and thousands of models. They found that R-squared, in the nonlinear context, could not discriminate between excellent models and appallingly bad models. There’s not really much point using R-squared in that context if can’t differentiate between such extreme models. Instead, R-squared was uniformly high. It’s just not a helpful measure to use in picking the better model in nonlinear regression.
So, you have the mathematical rational for not using R-squared in nonlinear regression and you the practical reason that it just doesn’t differentiated between good and poor models. However, for nonlinear regression, the answer is simple. Just use the standard error of the regression as I describe.
Thanks jim sir
You makes statistic interesting for many people. Whenever , I have doubt in statistics ,i just type on google “______________ statistics by jim”.Thank you again!.
Dear Jim,
thank you a lot for your effort to make this huge universe of statistics accesible and understandable to all! So far it helped me a lot through my studies. Now finally I am writing my bachelor thesis and I was wondering, if you could help me finding a reference which states that using r-square in linear regression modelling with curve fitting is valid and robust? Through this post I understand that it´s allowed. Nonetheless I need a reference to citate for my thesis and couldn´t find anything as helpfull as your post on this topic.
Hi Dennis,
I don’t have a specific journal article as a reference. However, any textbook that covers regression will support using R-squared for linear models. It’s a completely standard and acceptable goodness-of-fit measure for linear models.
Thanks for the your response, Jim! I started using Standard error of regression (S) for nonlinear fits. I was looking for other research articles which might have used it. I could only find one article: https://www.ncbi.nlm.nih.gov/pubmed/8289285 . Since, S is essentially RMSE (root mean squared error), this paper is using S for comparing 3D protein models.
Are you aware of any other research paper or a statistics textbook which has used or explains the use of S for nonlinear fits especially for biological data?
Hi Jim,
Thanks for your wonderful post! I was aware that R^2 cannot be used for reporting goodness of fit for nonlinear regression but I was unable to find a better statistic to report in research articles till I read this article.
Is it a good idea to report the ‘standard error of the regression, S’ alone in research articles to show the goodness of fit?
I saw your other post (https://statisticsbyjim.com/regression/standard-error-regression-vs-r-squared/) where you explain why to use S over R^2 and reporting both for goodness of fit of the model. For nonlinear fits, will it be a good option to report R^2 and S together?
Hi Darshan,
Thanks so much for your kind words! I really appreciate them!
For linear regression, I think reporting S alone isn’t a good idea because most people are expecting R-squared. I would particularly include both R-sq and S if you’re primarily using your model to make predictions. If you’re not making predictions, then reporting S isn’t as important, although I still like it!
I definitely would not report R-sq for nonlinear regression. R-sq is misleading for nonlinear models and can lead to incorrect conclusions (as the other blog post talks about). If you’re trying to publish in a journal and they require R-sq, then I guess go ahead and report it, but that would be a misguided policy on their part. In general, don’t report R-sq for nonlinear regression. You might need to explain why because it appears that many aren’t aware of the problems!