The residual sum of squares (RSS) measures the difference between your observed data and the model’s predictions. It is the portion of variability your regression model does not explain, also known as the model’s error. Use RSS to evaluate how well your model fits the data.
In least squares regression, the concept of the sum of squares (SS) is pivotal in quantifying several types of variability relating to a regression model. This statistical method assesses how effectively a dataset aligns with a specific function. The various kinds of SS are essential mathematical tools in identifying the function that most accurately mirrors the data.
Within this framework, the residual sum of squares is one of several types of SS. After fitting the model, it evaluates explicitly the amount of error between the dataset and the regression function. Learn about the other types of sums of squares.
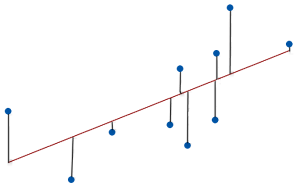
Mathematically, the residual sum of squares formula evaluates the distance between the observations and their corresponding fitted values. Specifically, it’s an overall measure of the size of the residuals. Ordinary least squares (OLS) regression minimizes RSS, producing the best possible fit for any given model.
Let’s learn how to use the residual sum of squares formula to calculate RSS, how to interpret it, and about some of its limitations.
Residual Sum of Squares Formula
The residual sum of squares formula is the following:

Finding the residual sum of squares involves summing the squared distances between each data point (yi) and its fitted value (ŷi).
To calculate the RSS, do the following:
- Take the y value for each observation and subtract the model’s predicted value for it (ŷ). That finds the residual (yi — ŷi) for each data point.
- Square all the residuals. This process guarantees a positive value for all data points.
- Sum the squared residuals.
As you can see, the procedure is literally the sum of the squared residuals. Alternatively, statisticians refer to this measure as the error sum of squares (SSE).
Note: Some notation uses RSS for regression SS instead of residual SS. Be aware of this potentially confusing acronym switch!
Interpreting RSS
It’s challenging to interpret a single residual sum of square value in isolation because it uses squared units and doesn’t adjust for sample size. However, you can compare RSS values between competing models for the same dataset. Typically, you want RSS to be as small as possible because it suggests that your model’s predictions are close to the actual observations. Smaller values reflect less model error and indicate that the regression function predicts values relatively close to the observed values. Your model fits the data well.
Zero is the smallest possible value, indicating a perfect fit with no error. The predicted values match the observed values exactly. However, you won’t see this condition with real-world data.
R-squared is the standard goodness-of-fit measure for linear models. Its formula incorporates RSS. Typically, you’ll evaluate R2 rather than the RSS because it avoids some of RSS’s limitations, making it much easier to interpret. See the limitations section next for more about that.
Learn more about How to Interpret R-squared.
Limitations of the Residual Sum of Squares
While valuable in regression analysis, the residual sum of squares has constraints.
Outliers Can Bias the Model
Least squares regression minimizes the RSS, which sounds great. However, the squaring process in the residual sum of squares formula gives outliers markedly more influence during model fitting than regular data points, potentially biasing the model.
Learn How to Find the Least Squares Line.
Unstandardized
The residual sum of squares formula does not standardize the results, complicating interpretation. It does not adjust for the data’s scale nor accounts for the sample size. If you have a model that fits two different datasets equally well, scale and sample size differences can produce two vastly different RSS values.
Consequently, you cannot determine whether a single RSS value in isolation is relatively low or not. While you can compare RSS values between models within the same dataset, the lack of standardization prevents you from comparing values between datasets.
Does Not Assess Other Assumptions
A low residual sum of squares does not guarantee that the model satisfies various least squares assumptions, such as linearity, error independence, and homoscedasticity. These problems can produce results you can’t trust. A low RSS doesn’t indicate you can trust the results. Check the residual plots to assess the regression assumptions!
In summary, RSS measures the amount of error in a model. In fact, least squares regression minimizes RSS to produce the best model fit. However, its susceptibility to outliers, interpretation difficulties, and inability to address model assumptions are critical limitations.

Hi Jim,
Thanks for the extremely helpful post, I just have one question about how to interpret the RSS value. I have used the RSS value to determine which model best fits my data set of 50 points. The question that I have is, what RSS constitutes a good fit? i.e. does an RSS of less than 5, 10, 15 or 20 etc. mean that the model fits the data well? (I understand that the closer the RSS is to zero the better the fit but does an RSS.) I guess what I am trying to say is, is there anything such as the critical value of the Chi-squared test for the residual sum of squares?
I’m sorry if this isn’t very clear (I only have a basic understanding of this!), but I would really appreciate any advice. Thanks in advance.
Hi Jack,
As I point out in the Interpretation section of this blog post, interpreting RSS is challenging. All you can really do with it is compare RSS values within the same dataset and know that small values are better. That’s it. There’s no critical values or anything like that. Typically, RSS is just a stepping stone for your statistical software to calculate more useful goodness-of-fit measures, such as R-squared and the Root Mean Square Error (RSME) or it’s close sibling the standard error of the regression (S).
However, it’s useful to know about RSS because it underlies those other statistics. But for interpretation, focus on the others because they’re easier. To help you choose which is better for your situation, read my post R-squared vs. Standard Error of the Regression. The choice depends on the main purpose of your regression model.
Hi Jim,
Thank you for your wonderfully explained posts!
I have a query regarding a multiple linear regression in a biological research problem.
My dependent variable is the number of bugs observed on 5 different plant species, with 20 replicates per plant species. My independent variables are the concentrations of 35 different plant chemicals, with 5 replicates per plant.
Since the number of observations I have for the dependent variable is different from the number of observations I have for the independent variables, can I still perform a multiple linear regression? If not, what can I do instead?
Your advice would be super helpful! Thanks in advance. Looking forward to your response.
Hi,
I’m not fully understanding what you’re doing. But, to perform regression analysis, you need to observe the dependent variable and independent variables on the same sample If you’re not doing that, you can’t use regression.
In other words, the 100 plants you’re counting bugs on must be the same 100 plants you’re measuring for chemicals. If you’re counting bugs and measuring chemicals on separate sets of plants, you just can’t do the analysis.
If I’m misunderstanding what you’re please let me know and describe more precisely what it is that you’re doing. But you mentioning the different number of observations for the DV and IVs makes me think you have different sets. Thanks!
Hi Jim . In my SEM analysis I got R^2 as 0.72 but only one significant path out of the seven proposed paths. How can I interpret the results
Hi Kavitha,
The fact that only one out of seven paths is statistically significant suggests that most of the relationships you proposed in your SEM model are not supported by the data. Remember that statistical significance does not always equate to practical or theoretical significance. Sometimes, a path might not be statistically significant but could still be theoretically important. Here are several possible reasons:
Some of the paths you hypothesized might not actually exist or are not as strong as anticipated.
If your sample size is small, it might not have enough power to detect significant effects.
The overall model might be misspecified. For instance, there could be omitted variables that are affecting the relationships, or some paths might be wrongly specified.
The one significant path in your model is important and suggests that there is a meaningful relationship there. Focus on understanding why this path is significant and how it relates to your overall theory or hypothesis.