Qualitative vs quantitative data is a fundamental distinction between two types of information you can gather and analyze statistically. These types of variables seem diametrically opposed, but effective research projects will use them together.
In this post, I’ll explain the difference between qualitative and quantitative data and show effective ways to graph and analyze them for your research.
Let’s start by exploring qualitative data and then move on to quantitative.
Qualitative Data
Qualitative data are descriptions, types, and names that you assign to each observation. In general, these data describe a characteristic and don’t involve a measurement process. Think QUALITY or attribute when considering qualitative data. The label for a qualitative observation relates to a category that doesn’t overlap with other categories (i.e., mutually exclusive), and you cannot order them in any meaningful manner.
The labels for qualitative variables frequently use words rather than numbers. However, analysts can use numeric codes to represent some qualitative data, such as part numbers, but they are still qualitative.
For example, architectural style, blood types, religion, and nationality are all qualitative because they describe or identify a type.
Synonyms for qualitative data include nominal and categorical.
Qualitative Examples
| Qualitative Variables | Mutually Exclusive Categories |
| College Major |
|
| Birth Nationality |
|
| Gender |
|
| Architectural Styles |
|
Quantitative Data
Quantitative data are measures or counts recorded using numbers. These data frequently describe how much, how many, or how often. Quantitative variables must use numbers. Think QUANTITY.
A critical difference between qualitative vs quantitative data is that you can order the quantitative observations but not the qualitative observations.
Quantitative variables can be continuous measurements on a scale or discrete counts. Learn more about continuous vs. discrete data.
For example, you measure heights and count the number of students in a classroom using numbers. These examples quantify a characteristic and involve a measurement or counting process. Additionally, you can order the students by height and the classrooms by the number of students.
A synonym for quantitative data is numeric.
Quantitative Examples
| Quantitative Variables | Values |
| Heights and weights | Measured on a continuous scale (m) |
| Temperature | Measured on a continuous scale (C) |
| Revenue | Discrete count |
| Number of students in a school | Discrete count |
Qualitative vs Quantitative Examples
As you saw above, there is a vast difference between qualitative vs quantitative data in research. However, most studies will need to record both types of variables to be effective. Below are examples of using qualitative and quantitative data together.
Consider an animal shelter studying its population and facilities. They’ll need to record a mix of variable types, as shown below.
| Qualitative | Quantitative |
| Species (Dog, cat, etc.) | Weight |
| Breed (German Shepherd, Siamese, etc.) | Age |
| Gender (Male or Female) | Length of stay in the shelter (days) |
| Types of cages | Cage areas (sq m) |
Qualitative vs Quantitative Analysis
The differences between qualitative and quantitative data affect the calculations you can perform for each type in your research.
For qualitative data, you label observations with mutually exclusive categories. You can’t order the categories nor determine the distance between them in any meaningful manner. These characteristics limit the calculations for these variables. Chiefly, you can count the number of times each categorical value appears and calculate their relative frequencies (percentages and proportions). For example, the shelter has 27 cats which comprise 45% of their animal population.
Learn more about Frequency Tables and Relative Frequency Distributions.
Conversely, for quantitative data, you can order the values, determine the precise difference between observations, add and subtract them, multiply and divide, etc. Consequently, it is possible to calculate numerous statistics, such as the mean, standard deviation, and Pearson’s correlation, among many others. For example, the cats in the shelter have an average weight of 12 pounds with a standard deviation of 2 pounds.
The differing characteristics determine which graphs and statistical analyses are best for qualitative vs quantitative data. Consequently, it’s crucial to determine whether each variable is qualitative or quantitative.
While there are numerous methods for each type, I’ll provide an overview of the top choices for graphs and statistical analysis.
Learn in greater detail about how various data scales affect calculations for Nominal, Ordinal, Interval, and Ratio Scales.
Graphing
For qualitative data, you’re working with category labels and need to display their counts or proportions. Bar charts are fantastic for this purpose and for displaying relationships between several qualitative variables in your research.

This bar chart displays ice cream preferences by gender, allowing you to see the relationship between these two qualitative variables.
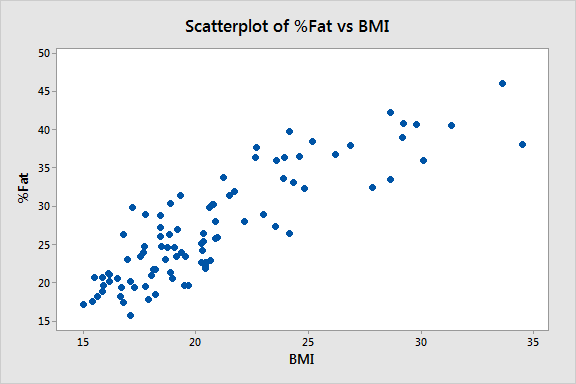
Other graphs are designed for quantitative data and highlight how the differences between values provide crucial information. Several top choices are histograms and scatterplots. These graphs display the distribution of a continuous variable and the relationship between two of them, as shown below.

You can use a bar chart for discrete quantitative data, such as counts.

Related Posts: Guide to Data Types and How to Graph Them, Bar Charts, Histograms, and Scatterplots
Statistical Analyses
Different inferential analyses are appropriate for the qualitative vs quantitative data in your research. Below are examples of the most common hypothesis tests. Click the links for more details on each!
For qualitative variables, you can use the following analyses:
- Chi-square Goodness-of-Fit Test: Determines whether the sample proportions of the categories follow a hypothesized set of population proportions.
- Chi-square Test of Independence: Evaluates if two qualitative variables are correlated.
- Two-sample Proportions Test: Determines if the difference between two sample proportions is statistically significant.
Analyses for quantitative variables include the following:
- T-tests: Assess differences between means
- Variance Tests: Evaluate variability
- Pearson Correlation: Measures the linear relationship between variables.
Learn more about Hypothesis Tests for Different Data Types.
In conclusion, you might think you’ll need to choose between qualitative or quantitative data. However, the best research uses both types. For instance, case studies frequently produce both qualitative and quantitative data. Be sure to understand their differences and know how to graph and analyze qualitative vs quantitative data!

Hi Jim. I was so excited when I saw the title of this post. Being someone who uses mixed methods I couldn’t wait to see what you had to say about qualitative data.
This isn’t what I call qualitative though! This is what I call nominal or ordinal data. You definitely can’t do thematic analysis on that! And not a chance you’re going to talk about Foucauldian discourse analysis or interpretative phenomenological analysis. Ah well. I live in hope!
Can you tell me – is there a reason you would call this data qualitative rather than nominal or ordinal?
Hi Christine, this post is about qualitative and quantitative DATA. You’re thinking of qualitative research. I’ve written an introductory/overview post about qualitative research, but most of my blog is about quantitative methods. Sorry to have gotten your hopes up!
BTW, nominal, categorical, and qualitative data are all synonyms, which I explicitly state in this post. Ordinal data is a mix of qualitative and quantitative. It would be hard to place in either category. However, there is a different classification scheme that includes it specifically: Nominal, Ordinal, Interval, and Ratio Scales.
Statisticians have different ways of classifying data types.