What is Kurtosis?
Kurtosis is a statistic that measures the extent to which a distribution contains outliers. It assesses the propensity of a distribution to have extreme values within its tails. There are three kinds of kurtosis: leptokurtic, platykurtic, and mesokurtic. Statisticians define these types relative to the normal distribution. Higher kurtosis values indicate that the distribution has more outliers falling relatively far from the mean. Distributions with smaller values have a lower tendency for producing extreme values. When you’re assessing a sample, outliers have the greatest impact on this statistic.
Kurtosis is a unitless measure of a distribution’s shape. Consequently, analysts use the value for a normal distribution as the baseline for comparing other distributions.
For instance, statisticians describe leptokurtic distributions as having higher kurtosis than the normal distribution. These distributions have “heavy tails,” indicating that they have relatively long tails that contain more outliers. Conversely, platykurtic distributions have “light tails” that are shorter and include fewer extreme values. Below, I’ll graph all three types for comparison.
Excess vs. The Unstandardized From
Excess kurtosis is a form of the statistic that helps you compare the tails of your distribution to those of the normal distribution. The excess form simply takes the standard statistic and normalizes it by subtracting 3. For instance, a normal distribution has a kurtosis of 3. The excess form subtracts three, causing a normal distribution to have an excess value of 3 – 3 = 0. Consequently, positive excess values indicate heavy tails, while negative values signify light tails.
To complicate matters, some computer programs, such as Excel, label their output as kurtosis but actually display the excess form. Note that the regular kurtosis cannot have negative values. Consequently, if you see a negative value, you know it is the excess version.
For the following sections, I’ll present the values for both forms for clarity.
Related posts: Descriptive Statistics in Excel and 5 Ways to Find Outliers
Graphing the Three Types of Kurtosis
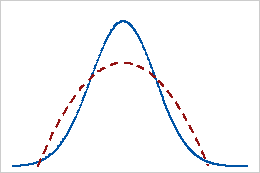
There are three types of kurtosis, and they all use the normal distribution as the basis for comparison. In the graphs, the blue distributions are normal, while the red distribution is the comparison. Below, I’ll graph mesokurtic, leptokurtic, and platykurtic distributions for comparison.
Related posts: Normal Distribution and Understanding Probability Distributions
Mesokurtic distributions

Leptokurtic distributions – High Kurtosis

T-distributions are leptokurtic for lower degrees of freedom, but they converge on the normal distribution as the DF increases.
Laplace distributions also have higher kurtosis than normal distributions. This distribution is symmetrical, but its tails approach zero more slowly.
Platykurtic distributions – Low Kurtosis

The uniform distribution is an extreme example of a platykurtic distribution because it does not produce outliers.
The beta distribution can also have low values.
Related post: Identifying the Distribution of Your Data
Reference
Westfall, Peter H. (2014), “Kurtosis as Peakedness, 1905 – 2014. R.I.P.“, The American Statistician, 68 (3): 191–195.

Leptokurtic refers to heavy tails and platykurtic refers to light tails. Neither characterizes the peak in any way – you can have a perfectly flat-peaked distribution with high kurtosis, and you can have an infinitely peaked distribution with low kurtosis.
One useful application is anomaly detection: high kurtosis variables exhibit anomalous data value(s), or data value(s) that are farther from the mean than predicted by the normal distribution.
High kurtosis does not necessarily indicate a large number of extreme data values. Kurtosis measures tail extension (specifically, a kind of leverage). A single, extreme data value is enough to give high kurtosis.
Hi Peter,
I agree, which is why I specifically do not mention the peak and, instead, focus on the tails. I found your article on it to be very informative.
That’s a great distinction. High kurtosis could indicate a broader than normal distribution or, as you point out, one or a few extreme values.
Thanks for your comments!
I remember leptokurtik (L), mesokurtik (M) and platykurtic (P) kurtosis but I cannot recall the real meaning or usefullness other than L and P were outside a normal distribution with L having short tails and higher peaks and P having long tails and shorter peaks….or do I have it backwards? How do i use this in the real world?