• Skip to secondary menu
  • Skip to main content
  • Skip to primary sidebar
  • My Store
  • Glossary
  • Home
  • About Me
  • Contact Me

Statistics By Jim

Making statistics intuitive

  • Graphs
  • Basics
  • Hypothesis Testing
  • Regression
  • ANOVA
  • Probability
  • Time Series
  • Fun
  • Calculators

Monotonic Function

By Jim Frost

« Back to Glossary Index

A monotonic function is a function that moves consistently in one direction—it either never decreases or never increases as the input increases. Monotonic functions can be either curved or linear, as long as the direction of change doesn’t reverse. Unlike linear functions, the change between values doesn’t have to be constant, which allows monotonic functions to bend.

There are two main types of monotonic functions:

  • Monotonically increasing: The function’s output either stays the same or increases as the input increases.

  • Monotonically decreasing: The function’s output either stays the same or decreases as the input increases.

A function is called strictly monotonic if it is always increasing or always decreasing, without any flat (constant) segments.

Positive Monotonic: tends to increase but not necessarily in a linear fashion. Example of a positive monotonic relationship
Negative Monotonic: Tends to decrease but not necessarily in a linear fashion. Example of negative monotonic relationship.
Non-Monotonic: No overall tendency to either increase or decrease Graph of non-monotonic relationship.

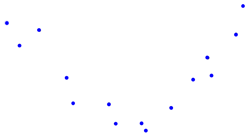
Monotonic functions are important in mathematics and statistics because they preserve order. If one input is larger than another, its output will also be larger (or smaller, in a decreasing function). This property is useful in ranking, comparing values, and transforming data in ways that do not alter the relationships between observations. Spearman’s rank order correlation can assess the strength of a nonlinear monotonic relationship.

For example, the natural logarithm function is monotonically increasing: as the input value increases, the logarithm also increases.

Graph that displays the monotonic function of the natural log.

Related

Related Articles:
  • Glossary: Spearman’s Rank Correlation Coefficient
  • Interpreting Correlation Coefficients
  • Glossary: Correlation
  • Nonparametric Tests vs. Parametric Tests
  • Spearman’s Correlation Explained
« Back to Glossary Index

Primary Sidebar

Meet Jim

I’ll help you intuitively understand statistics by focusing on concepts and using plain English so you can concentrate on understanding your results.

Read More...

Buy My Introduction to Statistics Book!

Cover of my Introduction to Statistics: An Intuitive Guide ebook.

Buy My Hypothesis Testing Book!

Cover image of my Hypothesis Testing: An Intuitive Guide ebook.

Buy My Regression Book!

Cover for my ebook, Regression Analysis: An Intuitive Guide for Using and Interpreting Linear Models.

Subscribe by Email

Enter your email address to receive notifications of new posts by email.

    I won't send you spam. Unsubscribe at any time.

    Buy My Thinking Analytically Book!

    Cover for my book, Thinking Analytically: An Guide for Making Data-Driven Decisions.

    Top Posts

    • F-table
    • Benford’s Law Explained with Examples
    • Cronbach’s Alpha: Definition, Calculations & Example
    • Z-table
    • How To Interpret R-squared in Regression Analysis
    • Multicollinearity in Regression Analysis: Problems, Detection, and Solutions
    • How to Interpret P-values and Coefficients in Regression Analysis
    • Box Plot Explained with Examples
    • Interpreting Correlation Coefficients
    • Normal Distribution in Statistics

    Recent Posts

    • Data Collection Methods: Step-By-Step Guide with Examples
    • ANOVA Calculator
    • Positive Predictive Value: Meaning, Formula, and Interpretation
    • Median Absolute Deviation Calculator
    • Median Absolute Deviation: Definition, Finding & Formula
    • Outlier Calculator

    Recent Comments

    • Skata na fas on Comparing Regression Lines with Hypothesis Tests
    • Jim Frost on Comparing Regression Lines with Hypothesis Tests
    • Skata na fas on Comparing Regression Lines with Hypothesis Tests
    • Skata na fas on Comparing Regression Lines with Hypothesis Tests
    • Jim Frost on Pareto Chart: Making, Reading & Examples

    Copyright © 2026 · Jim Frost · Privacy Policy